Enhance Reports with Power BI Measure Slicers & Fields
Add Dynamic Measure Slicers with Power BI Field Parameters – Learn to Enhance Your Reports Now!
Measure Slicers are extremely useful in viewing and analyzing data more efficiently in business intelligence tools. By using Power BI Field Parameters, creating and customizing Measure Slicers becomes a simple process. This video by Pragmatic Works, demonstrates a step-by-step guide to creating Measure Slicers using Field Parameters.

In Power BI, Field Parameters allow users to toggle between different fields within their data models, significantly enhancing the flexibility of report views. This feature not only provides users with the ability to select the x-axis on visuals but also conserves space on the report canvas. It involves adding a new table to the data model and manipulating the fields with a slicer on the report canvas.
Implementing Field Parameters: A Step-by-Step Guide
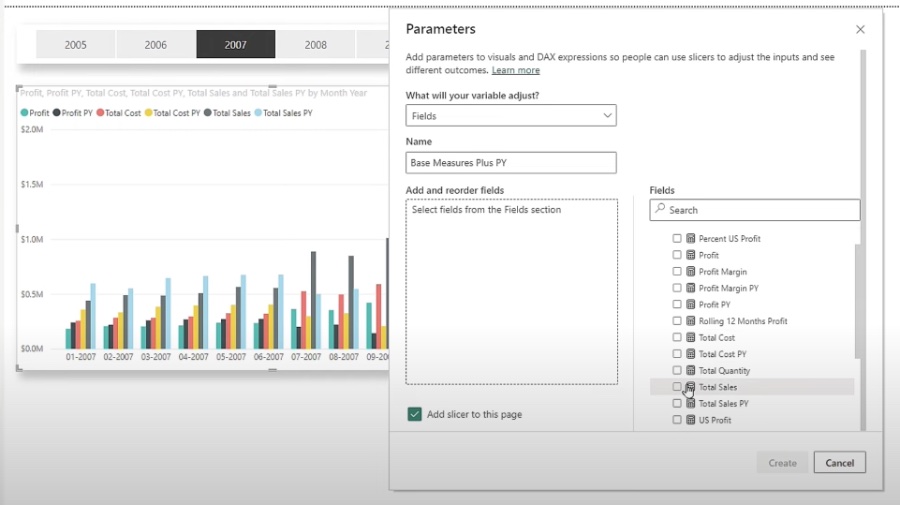
An in-depth procedural outline is given to set up Field Parameters properly. It starts with opening Power BI and selecting a report, followed by introducing a new parameter and configuring specific settings. The tutorial continues through various steps for applying the Field Parameters, concluding with their incorporation into a report's visuals.
- Open Power BI and load relevant data by using 'Get Data' from the 'Home' ribbon
- Create a new parameter, defining the fields and sequence for your analysis
- Configure Field Parameters through the 'Modelling' section and 'New Parameters' option
- Add a slicer to the report page which will allow users to toggle between selected fields
- Use the newly created Field Parameter to change the x-axis of a clustered column chart
- Observe how selections from the parameter slicer alter the chart's title and axes accordingly
Creating Measure Slicers with Field Parameters in Reports
The video tutorial dives into the practical usage of Field Parameters in Power BI to establish Measure Slicers within reports. Measure Slicers streamline the data analysis process, allowing for a more efficient way to digest information. Users will learn how to create and customize these slicers for an improved experience.
Enhancing Flexibility in Visuals with Field Parameters
Field Parameters provide a method to alter the x-axis dynamically in Power BI visuals, presenting report users with choice and flexibility. This feature contributes to conserving space on the report canvas, and is managed through an additional table in the data model. The tutorial covers enabling Field Parameters and applying them to create dynamic visuals.
Power BI Field Parameter Feature
Understanding the functionality of the Field Parameter feature within Power BI is essential for data analysts keen to enhance their reports. This feature allows for noteworthy customization and interactivity, as users can select from a range of predefined fields to determine what data is displayed on the x-axis of their visuals. Whether managing sales numbers or analyzing different market segments, the ability to swiftly alter views without creating multiple charts is invaluable. Organizations adopting this technique can expect not only a sleeker report design but also a more compelling data storytelling capability.
Summary of Field Parameter Implementation
Ami Diamond, with extensive expertise in data visualization and analytics, explains how to leverage Field Parameters to create a dynamic reporting environment.
Power BI users are afforded increased flexibility and space-saving options through this walkthrough. The comprehensive guide highlights the steps from data loading to chart customization for a practical understanding.

People also ask
Can I use a parameter as a slicer in Power BI?
Yes, you can use what's called a "What-if parameter" as a slicer in Power BI. This feature allows users to create dynamic models that can reflect what-if scenarios. You create a parameter that can be adjusted using a slicer, which will dynamically update the visualizations in the report.
How do you pass parameters to a report in Power BI?
To pass parameters to a report in Power BI, you generally use a feature called "Query string parameters." These parameters are appended to the report URL, which allows you to filter the report page to display specific information or visualizations based on the values passed through these parameters.
How do I add a slicer to a report in Power BI?
To add a slicer to a report in Power BI, you need to go to the "Visualizations" pane and select the "Slicer" icon. From there, you can select a field for which you want to create a slicer, and it will be added to the report canvas. You can then configure various settings of the slicer to control its behavior and appearance.
How do you create a dynamic parameter in Power BI?
To create a dynamic parameter in Power BI, you can use the "New Parameter" option from the modeling tab, which allows you to create a What-if parameter. This parameter provides a range of numeric values represented by a slicer which can be tied to measures or calculations in your report, allowing your reports to change dynamically as users adjust the parameter.
Keywords
Power BI Field Parameters, Measure Slicers, Report Customization, Dynamic Measures, Interactive BI Reports, Field Parameter Implementation, Power BI Slicer Tutorial, Advanced Power BI Tips, Data Visualization Techniques, Business Intelligence Reporting
