Reviewing Planner Gantt Chart with Application Insights
Unlock insights into your apps activity with Azure Application Insights - a Microsoft experts review on Planner Gantt Chart update.
Looking Back at the Launch of Planner Gantt Chart
Last December saw the release of a new iteration of the Planner Gantt Chart application. This update centered on adding an instrumentation key, an overlooked but essential element in the app. Please be aware that statistics contained herein pertain to post-updated downloads from the relevant repository, assuming no removal of the aforesaid key.
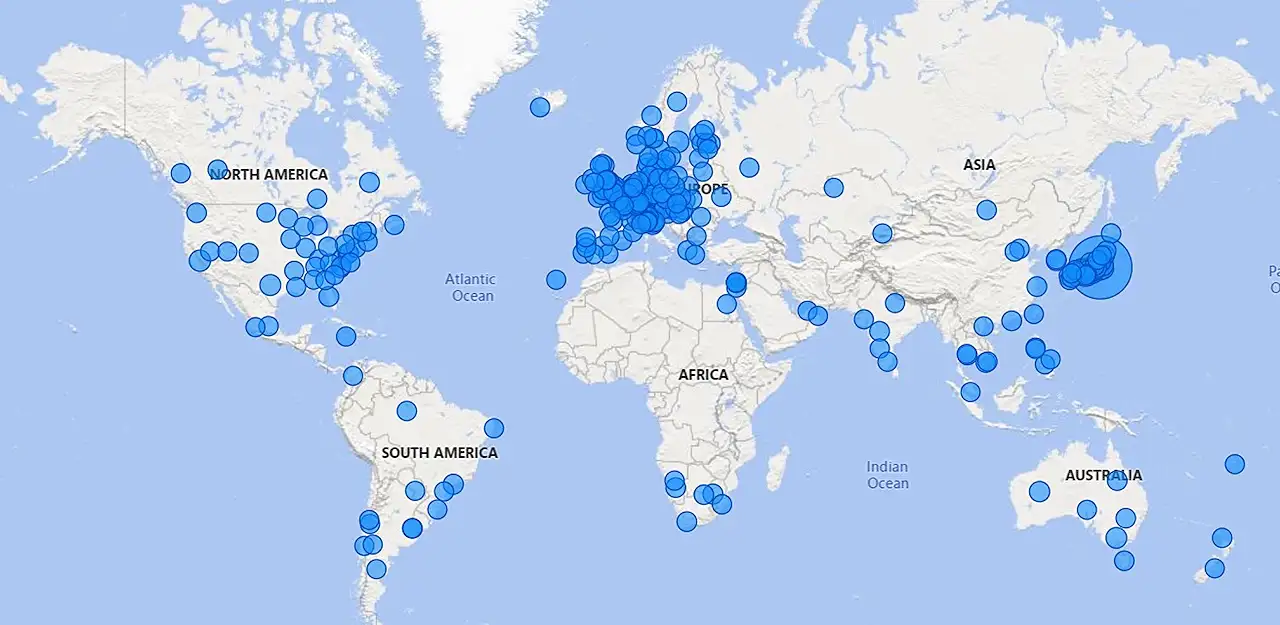
For the uninitiated, Azure Application Insights enables superior tracking of app usage by merely setting the instrumentation key in the App object property pane. This key can be procured from the Overview blade of the Application Insights resource. Once configured and your app logs activity, key insights into usage patterning can emerge. For instance, analytics data from the past 24 hours reveals 152 unique sessions, most of them originating from Japan.
With a modest grasp of Power BI, the author utilized the application's features to draw additional data and construct report views. Application Insights has a conveniently ready-made M query function which is usable in Power BI Desktop.
Utilizing Power BI
Having obtained your KQL query, you can convert it into an M query akin to the provided example. Depending on your preference, you can manipulate the timespan parameter to yield more expansive log data. Please note, by default Application Insights only maintains logs for a brief period, however, log duration can be increased via the Log Analytics workspace's Usage and Estimated Costs blade's Data Retention panel.
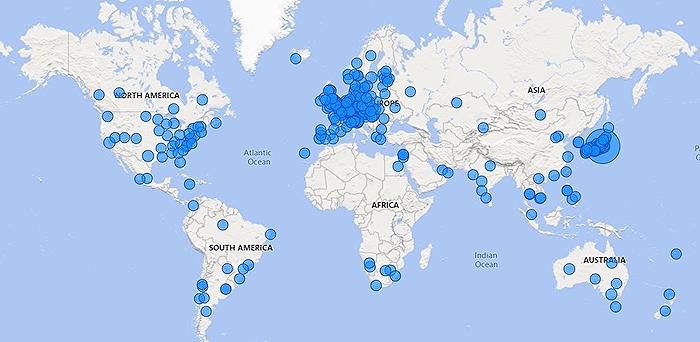
Currently, the author has set the value to 365 days to sync with his M query's value. This setup culminated in two report pages, revealing that the app has blossomed to 1311 distinct users as of March 15th, 2023 — an underestimate since the instrumentation key addition in December. The data also uncovers an average of ten new daily users and a growing user base in Japan.
The Importance of Utilizing Application Insights
Application Insights' primary use is aiding developers in increasing the performance and usability of their apps. By utilizing this tool, developers can gain insights into how their application is utilized and how it performs. It provides live metrics, custom dashboards, and a powerful analytical query language, enabling closer examination of data. Additionally, it can integrate with DevOps processes to ensure informed decisions during planning and development. Consequently, Application Insights is an essential tool in a developer's arsenal when aiming to understand, improve, and monitor application performance.
Read the full article Application Insights - Planner Gantt Chart – looking back

Learn about Application Insights - Planner Gantt Chart – looking back
The Gantt Chart App for Planner, developed by Microsoft, recently underwent an update in which an "instrumentation key" was introduced. This key allows for better tracking of the app's usage data, ultimately leading to more effective implementation and user experience enhancements.
The Planner Gantt Chart is a handy tool, developed by Microsoft, for project management and organization. In its December 2022 update, a feature that allows monitoring and gathering data about app usage was introduced. This feature, known as Application Insights, operates through an 'instrumentation key' included in the App. This welcomed addition allows developers to track the app's activity via Azure Application Insights, ensuring a comprehensive understanding of user interaction for better improvement of the app.
Once the instrumentation key is added to your app's properties panel, you can find this key through the Overview blade of your Azure Application Insights resource. Then, once your app starts being utilized by consumers, useful data regarding app usage is collected. This proves pivotal in evaluating app performance and making necessary enhancements.
Interesting revelations from the data include data usage from unique sessions, analyzing this data can provide a clear indication of the global coverage of the app. In the case of the Planner Gantt Chart app, the majority of users were found to be from Japan within the last 24 hours.
The valuable data collected from Application Insights can further be used to generate meaningful reports. Using Power BI, a business analytics tool from Microsoft, data from Application Insights can be transformed into informative report views. The application provides users with an M query which can easily be utilized in Power BI Desktop. This way, linkages between data points can be better understood which subsequently leads to the generation of precise and detailed reports.
- Moreover, the Kusto Query Language (KQL) query that is used above provides an M query which can then be used for Power Query in Power BI Desktop and Excel.
- The M query can also be used to fetch more logs if the duration value is increased. This can be changed in the timespan property to fetch logs for a longer period.
- Additionally, please be aware that Application Insights only stores logs for a limited amount of time. But thankfully, you can customize this via Log Analytics workspace’s “Usage and Estimated Costs” blade’s Data Retention panel.
- Organizing and configuring the query in Power BI Desktop, allows for the creation of report pages. These report pages can then provide detailed user data, including number of distinct users and their geographical location.
This technology has a wealth of uses, bringing greater data transparency for both application developers and end-users, leading to better decision-making processes and ultimately, a more refined user experience. With this tool, developers around the globe will be able to streamline and improve their application functionality, leading to greater user satisfaction and increased usage.
More links on about Application Insights - Planner Gantt Chart – looking back
- Planner Gantt Chart – looking back - terhoantila.com
- Mar 15, 2023 — Configuring Application Insights instrumentation key. If you didn't know, you can track your app's activity in Azure Application Insights by ...
- Application Insights - Planner Gantt Chart – looking back
- Mar 24, 2023 — You may have noticed that I published a new version of my Planner Gantt Chart app the 8th of December last year.
Keywords
Application Insights, Planner Gantt Chart, Tracking Progress, Productivity Tools, Project Management, Scheduling Software, Business Solutions, Advanced Analytics, Efficiency Planning, Task Visualization