- All of Microsoft
Master Power BI: Unveil Key AI Influencers Visuals
Unlock Insights with Power BI Key Influencers Visual - Learn Best Practices & Tips!
Key insights
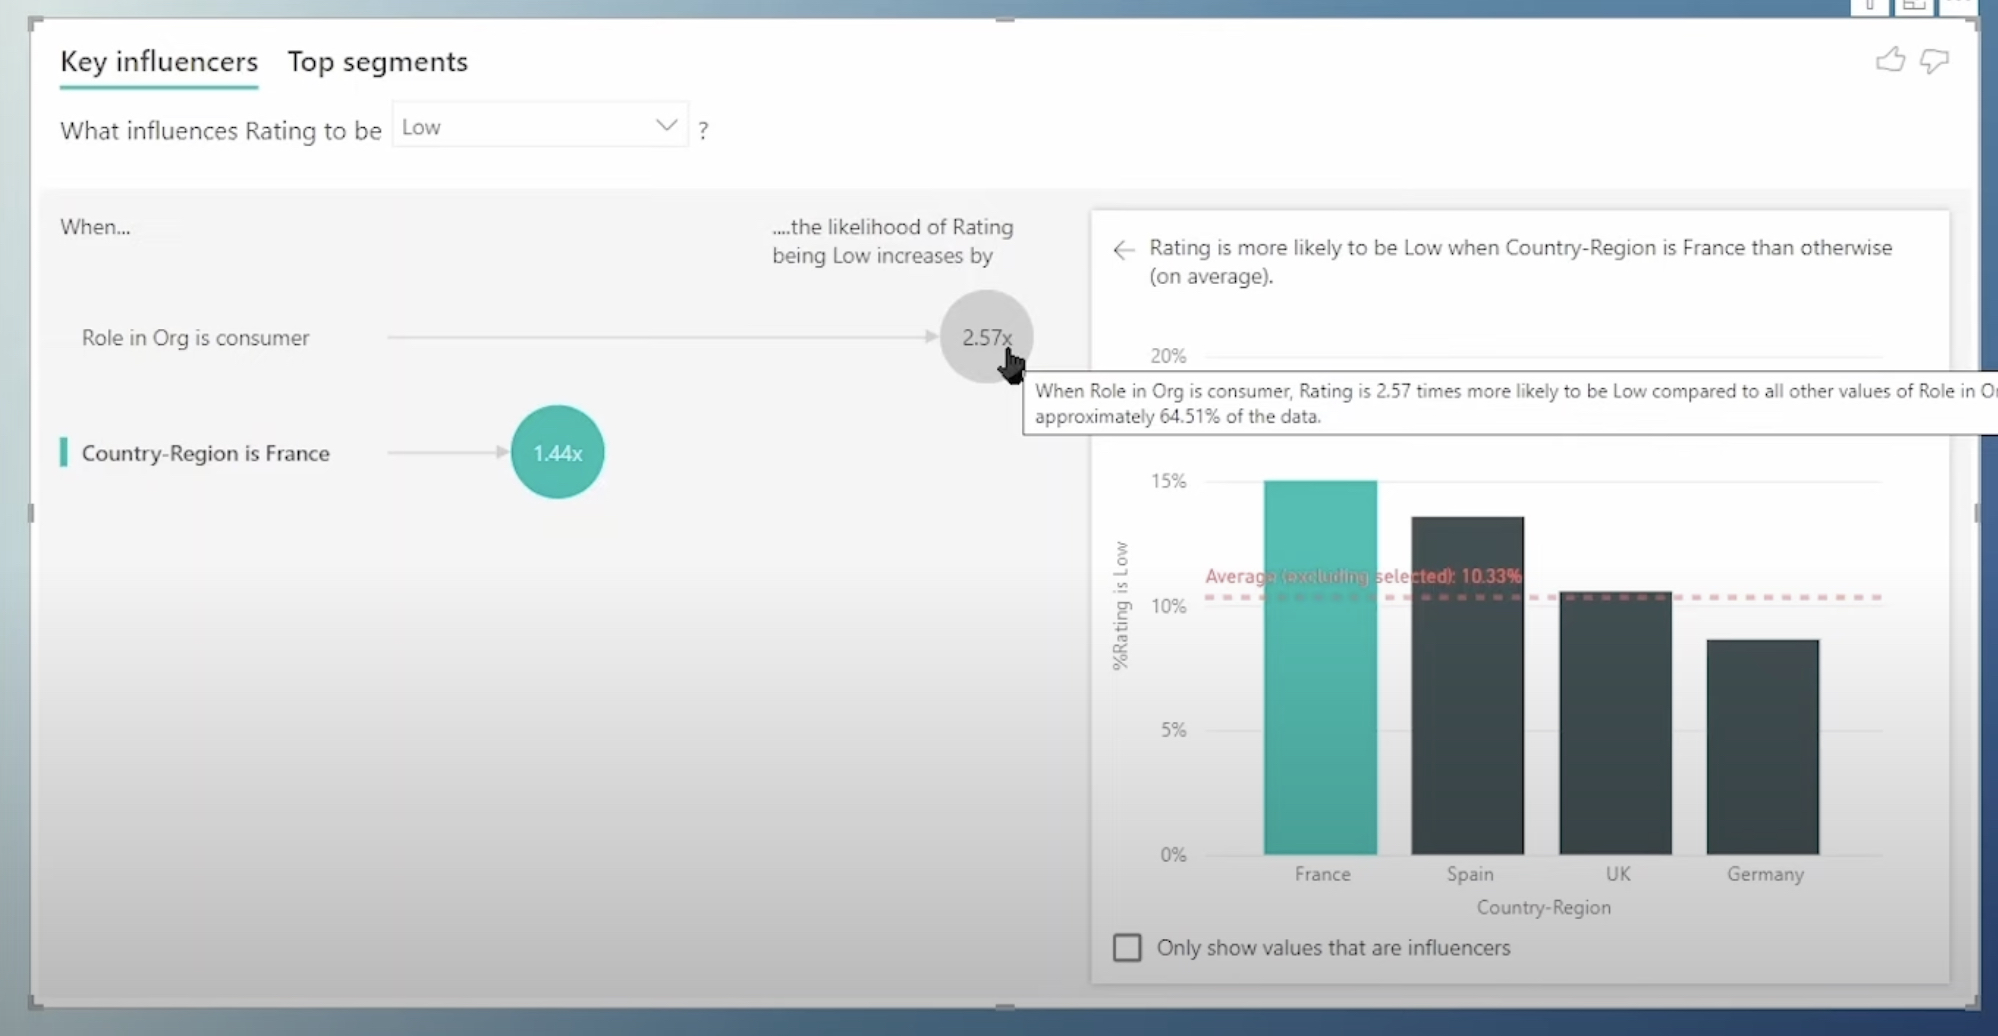
- Gain insights into your data using the Key Influencers Visual in Power BI.
- Discover essential tips and best practices for using the Key Influencers Visual effectively.
- Understand how the visual works to influence and identify pivotal data points.
- Learn about customer ratings analysis and other additional factors via practical examples.
- Explore the Key Influencers and Top Segments tabs to delve deeper into data segmentation.
Deep Dive into Key Influencers Visual in Power BI
The Key Influencers Visual in Power BI is a powerful tool designed to help users uncover key drivers that affect various metrics. This feature allows for a decisive visualization of data, facilitating easy identification of what factors most influence desired outcomes. Users can segment data, allowing for deeper insights into specific datasets such as customer behavior, product performance, or operational efficiency.
The tool is incredibly user-friendly, providing a guided experience that assists users in setting up and optimizing their visualizations effectively. This involves analyzing various influencing factors and understanding how they interconnect to affect wider business metrics.
Whether you are looking into customer ratings, operational data, or financial figures, the Key Influencers Visual equips you with the capability to make informed decisions backed by solid data-driven insights. Its integration with Power BI ensures that it fits perfectly into the broader analytical capabilities that Microsoft's suite provides, complementing other tools and features within the ecosystem.

Exploring Key Influencers Visual in Business Intelligence
The tutorial provided by Pragmatic Works focuses on deploying the key influencers visual in Power BI to drive deeper insights from business data. This visual tool is introduced as a part of a larger strategy to harness the full potential of AI in visualizing and interpreting complex data sets.
The educators at Pragmatic Works begin by demystifying the concept of the key influencers visual, explaining its purpose and operational framework.
This educational session is also enriched with various tips and best practices shared throughout. These insights are designed to help users not only apply the tool effectively but maximize their outcomes by understanding intricacies better.
Moreover, experience sharing from the field adds a practical angle to the theoretical knowledge conveyed, making it more palatable for professional use.
Beyond the focus on the Key Influencers Visual, Pragmatic Works suggests several continuous learning paths. This includes a mix of on-demand learning options and access to broader resources aimed at enhancing skills in other Microsoft products such as Teams, Compute, and Power Apps.
These educational paths are tailored to various learning styles and professional demands, thus ensuring that learners at all levels can find suitable formats.
Engagement and Learning Opportunities
While the specific link and promotional materials are omitted, it’s evident Pragmatic Works encourages ongoing interaction and learning through a variety of formats.
The array of learning opportunities span from free community plans to structured boot camps and private trainings, aiming to cater to different organizational needs and personal learning preferences.
Social media and contact integration are also highlighted, stressing the importance of staying connected with the educational provider. However, those specific details are not included here.
Engaging with such platforms can ensure users receive the most current updates and have access to supplementary resources and community support.
Conclusion
Conclusively, this YouTube video by Pragmatic Works serves as both an instructional guide on using the key influencers visual in Power BI and as a gateway to further educational resources. Through effective training, users are equipped to transform raw data into insightful, actionable intelligence.
This empowers them to not only understand their current business landscape better but also predict future trends more accurately.

People also ask
"What is the key influencer visualization in Power BI?"
"What is a key factor in visualization in Power BI?"
Answer: "In Power BI, the Key Influencers visual is crucial for pinpointing significant elements within your dataset. It works by examining the relationships between various variables and determining which ones are most closely linked to specific outcomes you are studying.""What are the AI visuals in Power BI?"
Answer: "AI visuals in Power BI, also known as Artificial Intelligence visuals, are sophisticated tools that integrate machine learning capabilities to provide deeper analytical insights. These visuals are capable of handling large data sets, recognizing patterns, and presenting the findings in formats that are easy to interpret.""What is the explanation of visuals in Power BI?"
Answer: "In Power BI, visuals, or visualizations, serve the purpose of showcasing insights derived from data analysis. A Power BI report may contain a variety of visuals on a single page or across multiple pages. The Power BI service allows for these visuals to be pinned from reports to dashboards, enhancing their utility and accessibility."
Keywords
Key Influencers Visual, AI Visuals Power BI, Power BI AI Features, Understanding Key Influencers in Power BI, Power BI Data Visualization, AI Enhanced Analytics Power BI, Visual Analytics Power BI, Advanced Power BI Techniques
