- All of Microsoft

Create Stunning Excel Gantt Charts Easily
Co-Founder at Career Principles | Microsoft MVP
Unlock Project Management Mastery: Create Dynamic Gantt Charts in Excel in 4 Simple Steps!
Key insights
- Create a Gantt Chart in Excel for project management in 4 simple steps, making it fully dynamic.
- Start by adding all values and formatting the chart, then create a dynamic date timeline and conditional formatting formulas.
- Learn how to track the progress of tasks, adjust for new activities, and utilize conditional formatting for current week tracking.
- Understand the basics of Gantt Chart construction in Excel, including preparing data, creating a stacked bar chart, and formatting.
- Gantt Charts enhance project visualization, scheduling, communication, and resource management.
Exploring the Benefits of Gantt Charts in Project Management
Creating a Gantt Chart in Excel serves as a crucial tool in project management, providing a visual timeline that outlines the tasks involved in a project, their durations, and the order in which they must be completed. This visualization aids not just in planning and scheduling but also plays a significant part in communication between project members, stakeholders, and clients, ensuring everyone has a clear understanding of project timelines and deliverables.

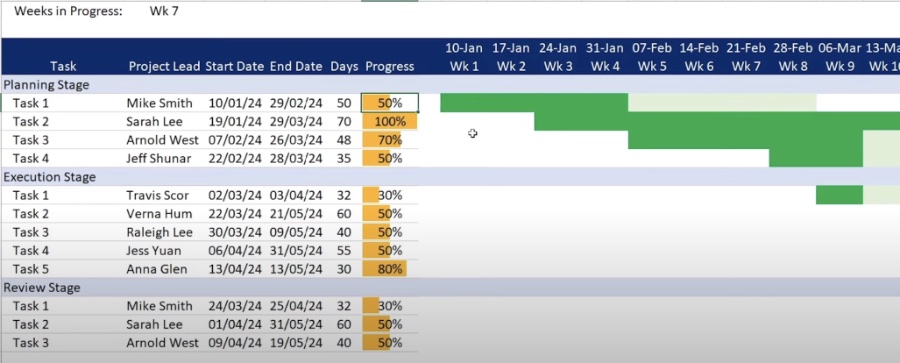
Kenji Farré, with the expertise of a Microsoft MVP, has unleashed an enlightening tutorial on creating a dynamic Gantt chart for project management in Excel. This video meticulously demonstrates transforming raw project data into a fully customizable Gantt chart in four easy steps. It's noteworthy how the chart dynamically adapts to changes in project start dates, allowing for real-time progress tracking and task updates.
The tutorial initiates with the basics: inputting values and setting up the chart’s format. It progresses into developing a dynamic timeline that reflects weeks, employing conditional formatting to breathe life into the chart. Kenji doesn't stop there; he delves into optimizing the chart’s view, ensuring that tracking current weekly progress is a breeze through strategic pane freezing and additional conditional formatting.
Kenji extends beyond the tutorial to offer a comprehensive guide on Gantt chart essentials. From preparatory data structuring, through the crafting of a stacked bar chart, to pivotal chart customizations, he covers all grounds. This segment ensures even beginners can grasp the method to format charts efficiently, customize visually appealing elements, and reverse task orders for traditional Gantt aesthetics.
But why invest time in Gantt charts? Kenji elucidates their integral role in project visualization, scheduling precision, and effective communication. Gantt charts emerge as indispensable tools for visualizing project timelines, optimizing resource allocation, and enhancing stakeholder engagement. With clear task definitions, accurate duration estimations, and up-to-date progress tracking, they serve as a foundation for successful project management.
To augment the utility of Gantt charts, Kenji suggests leveraging conditional formatting for task milestone highlights and advocating for the use of templates to streamline future projects. For those tackling complex projects, he recommends considering dedicated software equipped with advanced features to elevate project management.
Expanding on Gantt Charts in Project Management
Gantt charts are not just a feature of project management; they are a cornerstone for successful project execution. These visual tools encapsulate the essence of project scheduling and management, presenting an aerial view of a project’s timeline, tasks, and progress with incredible clarity. Utilizing software like Excel facilitates the creation of Gantt charts, empowering project managers to visualize the sequence of tasks, assess task durations, and identify critical paths effortlessly.
Successfully implementing Gantt charts requires a thoughtful approach to defining tasks, estimating durations, and updating the chart to reflect real-time progress. Such meticulous planning and execution engrain efficiency and predictability into project management, enabling teams to meet deadlines and manage resources effectively.

People also ask
How do you make a good Gantt chart in Excel?
To create an effective Gantt chart in Excel, simply follow the step-by-step process outlined for constructing one in the application.
How do you make a Gantt chart look nice?
To enhance the visual appeal of your Gantt chart, minimize the white space between the task bars by selecting any of the bars (they'll all get selected), right-clicking, choosing Format Data Series, and adjusting the Separated setting to 100% and the Gap Width to 0% or near zero.
How do I get Gantt chart wizard in Excel?
To access the Gantt Chart Wizard in Excel, navigate to the left column, expand the menu under Choose commands from, select Commands Not in the Ribbon, scroll down, and select Gantt Chart Wizard.
How do I create a milestone Gantt chart in Excel?
To quickly add a milestone to your Gantt chart in Excel, you can insert a task that has zero duration. This can be done by going to View, then within the Task Views group, selecting Gantt Chart, and either entering the name of the new milestone in the first available row or transforming an existing task into a milestone.
Keywords
Gantt Chart Excel Tutorial, Create Gantt Chart in Excel, Excel Gantt Chart Template, How to Make a Gantt Chart, Easy Excel Gantt Chart, Microsoft Excel Gantt Chart, Gantt Chart Excel Guide, Excel Project Management Chart