Switch From Pivot Tables to NEW Formula
Excel Pivot Tables Outdated? Embrace GROUPBY for Real-Time Updates & Efficiency.
Key insights
- Explore the advantages of using the GROUPBY function over pivot tables in Excel, which offers automatic updates without the need to manually refresh.
- Understand the limitations of pivot tables which do not automatically update when the original data changes, requiring a manual refresh.
- Learn about the PIVOTBY function, a similar tool to GROUPBY but with additional features such as allowing column input values.
- Gain insights on operating the GROUPBY function, including techniques on sorting, filtering, adding field headers, and incorporating total depth into your analysis.
- Discover the structured chapter breakdown for learning GROUPBY and PIVOTBY, including specific segments focused on improving functionality like adding more than one row, and calculating % of total.
Excel's GROUPBY and PIVOTBY Functions

Excel users seeking to enhance their data analysis techniques can benefit significantly from understanding the GROUPBY and PIVOTGraphQL functions. These tools offer a more dynamic and efficient approach compared to traditional pivot tables. Particularly, the GROUPBY function is advantageous because it automatically updates whenever the underlying data changes, obviating the need for manual refreshes. This function facilitates data manipulation tasks like sorting, filtering, adding headers, and calculating totals, making it incredibly useful for comprehensive data analysis.
Discover a New Approach to Data Summarization Beyond Pivot Tables
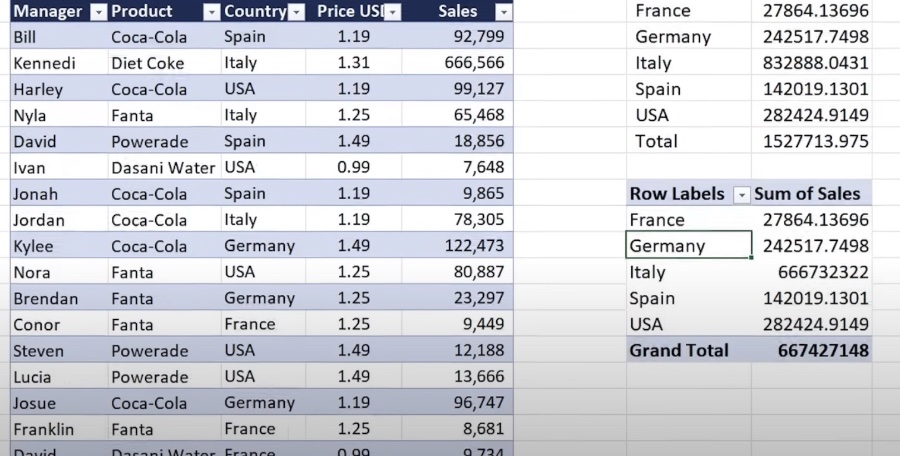
The recent YouTube video by Kenji Farré (Kenji Explains) [MVP] introduces an alternative to the traditional pivot tables in Excel. The video specifically emphasizes the use of the new GROUPBY function, which boasts automatic updates, a feature pivot tables lack. Kenji delves into how the GROUPBY function simplifies the process of working with changing data sets without the need to manually refresh the table.
Exploration of GROUPBY Function
- The GROUPBY function stands out because it updates automatically when the original data changes. This is contrasted with pivot tables that require a manual refresh.
- This automatic update feature not only saves time but also decreases the chance of working with outdated data. Kenji illustrates the advantages of GROUPBY by walking viewers through its application in real-time scenarios.
- Moreover, Farré explores other capabilities of the GROUPBY function like sorting, filtering, and adding headers and total cells to the data array.
Understanding PIVINOTBY and Enhanced GROUPBY Features
- In addition to GROUPBY, Kenji introduces the PIVOTBY function, which allows for more complex data manipulation, including handling multiple column input values.
- The tutorial covers how to utilize these functions in Excel to perform tasks that traditionally required several steps in pivot tables. This includes creating percentages of totals, adding more than one row, and extensive filtering options.
- The seamless integration of these functions into typical data processing workflows showcases their utility in handling robust data operations efficiently.
Step-by-Step Tutorial Guidance
- The video is structured into chapters, making it easy to follow and refer back to specific functions or features discussed.
- Kenji takes a methodical approach, ensuring that each function is covered comprehensively from setup to execution. This is particularly beneficial for learners new to Excel's advanced features.
- By the end of the video, viewers are expected to gain proficiency in using both GROUPBY and PIVOTBY functions, enabling them to optimize their data analysis and reporting tasks more effectively.
Further Insights on Advanced Excel Functions

People also ask
"How to use formula instead of PivotTable?"
To transform a PivotTable to formulas, click on the PivotTable, proceed to the Options tab, select OLAP Tools within the Tools group, then choose Convert to Formulas. This process completes automatically if no report filters are present; otherwise, the Convert to Formulas dialog box appears for further actions.
"What can I use instead of a PivotTable?"
The PIVOTBY function in Excel serves as an alternative to PivotTables by building dynamic summary reports that mimic PivotTables but are inherently dynamic, eliminating the need for manual refresh. While they use a straightforward formula approach, they lack the full functionality of traditional PivotTables.
"How do I convert a PivotTable to a regular Excel spreadsheet?"
To convert your PivotTable into a standard Excel spreadsheet format, press 'Ctrl + A' to select the entire table, then press 'Ctrl + C' to copy the selected data.
"What is better than PivotTables?"
Comparing Power Pivot with traditional PivotTables, each tool offers distinct advantages for data analysis within Excel. PivotTables excel in rapid and easy data summarization from a single data source. Power Pivot, in contrast, enables the analysis of larger data volumes from varied sources, providing a more robust data handling capability.
Keywords
Excel formulas, advanced Excel tips, alternatives to pivot tables, Excel data analysis, improve Excel skills, Excel reporting techniques, Excel efficiency, Excel pivot table alternatives
