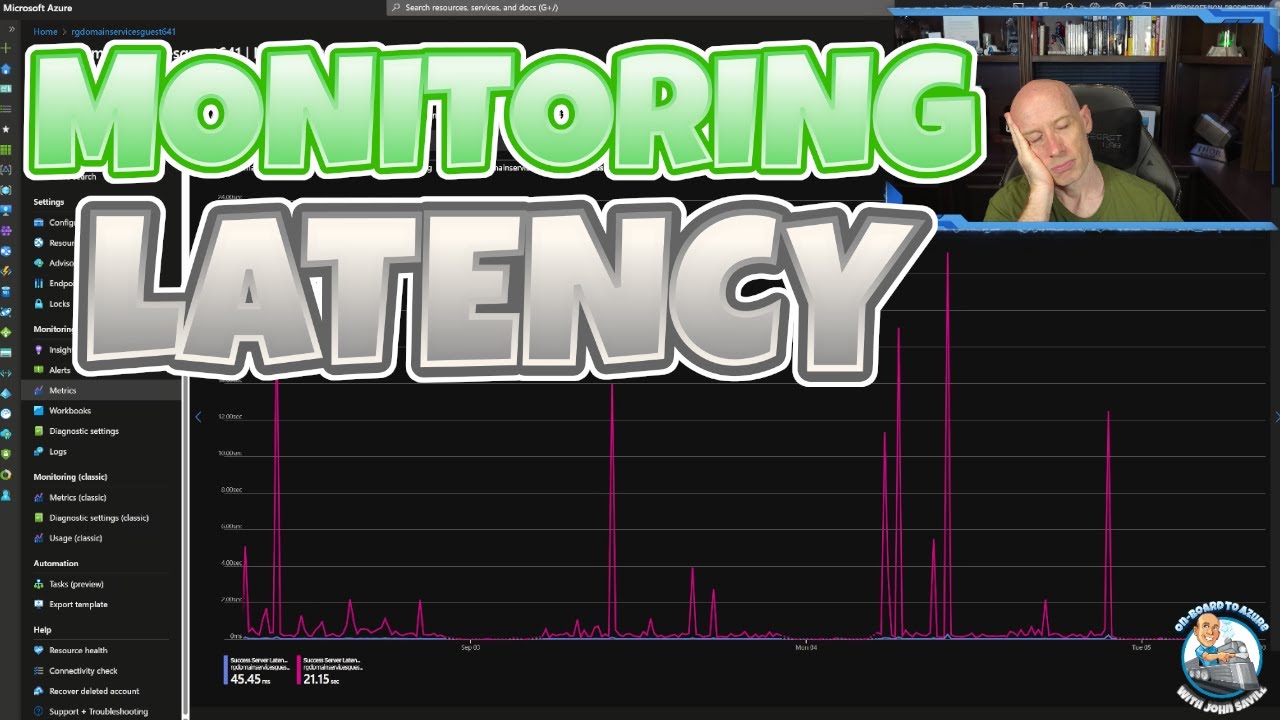
Azure Latency Monitoring Metrics
A look at why average for latency is not a good metric to look at.
Latency Monitoring Metrics provides a clear depiction on why using an average for latency might not be an accurate method. It emphasizes understanding different aspects of latency such as what it is, the implications of average latency, the true impact, maximum latency and how the average can obscure the details. The discussion also includes operations for a complete interaction and diving into the details rather than oversimplifying the situation. It ends with a discussion on latency distributions and how context matters when interpreting them.
- What is latency
- Average latency and its implications
- Why relying on average can be misleading
- Concept of Max latency
- How average latency can mask true impact
- Importance of context and detail in understanding latency
- Reviewing operations needed for a complete interaction
- Discussion on latency distributions
- A dive into the detailed examples
Further, it gives insight on how Cloud Monitoring works in terms of data retention and latency. It elaborates how data is acquired, held for a specific time period and then deleted after expiration. Also, it clarifies how latency of a new metric data point comes into existence after written, including considerations of the monitored resource and other factors. Additionally, the textual content highlights about metrics, including the impact of user-defined metrics when employed with Monitoring API for writing data points.
Finally, the text guides on the ideal retrieval time depending on the system operations, expressing that user-defined metrics can retrieve the data in seconds, while initiating a new time series would take several minutes.
Diving Deeper into Latency Monitoring Metrics
A comprehensive understanding of latency metrics can transform how you analyze and improve your system. While an average latency might provide a superficial overview, it is essential to delve into latencies at maximum levels, understand the actual impacts and consider the complete operations necessary for an interaction. Also noteworthy is how user-defined metrics using Monitoring API can retrieve data in seconds, enhancing the efficiency in system performance.
Learn about Latency Monitoring Metrics

The text primarily discusses the concept of latency monitoring metrics, emphasizing that the average latency metric may not be an accurate measure. It is detailed that Cloud Monitoring gathers and retains metric data for a certain timeframe, which is different for each metric type. When the period ends, the data points are deleted along with the entire time series.
Latency in metric data means the duration it takes for a new metric data point to be available in Monitoring after it is written. This time varies according to the monitored resource and other factors, such as the sampling rate and the retrieval time of the data. The post recommends allowing for some latency before retrieving metric data. For instance, when using user-defined metrics and if a new data point is written to an existing time series, it can be pulled in a few seconds. But, when writing the first data point to a new time series, retrieval might take a few minutes.
More links on about Latency Monitoring Metrics
- Use metrics to diagnose latency | Cloud Spanner
- The latency metrics for Spanner measure how long it takes for the Spanner service to process a request. The metric captures the actual amount of time that ...
- Performance Metrics of an ISP Latency Monitor
- Analyze connectivity throughout the network path, assess ISPs' SLAs, and identify areas of high latency using Site24x7's ISP monitor.
- Metrics: Latency, CPU, Memory, Error Rates - Introduction
- Latency, or lag, is the total time needed for a data package to get from one point on a network to another and is mostly measured as the delay between a user's ...
- 19 Network Metrics: How to Measure Network Performance
- Mar 6, 2023 — Learn how to measure network performance with key network metrics like throughput, latency, packet loss, jitter, packet reordering and more!
- How to Measure Latency - Obkio
- May 17, 2023 — Latency metrics are measurements used to quantify and evaluate the delay or time lag in various aspects of networking and system performance.
- Compare a Service's latency to the previous week
- Datadog can show you the latency of your application over time and how it compares to similar moments in previous time frames such as week, month, etc.
- “Four Golden Signals” for monitoring systems
- The four golden signals of monitoring are latency, traffic, errors, and saturation. If you can only measure four metrics of your user-facing system, ...
- Redis latency monitoring
- For all these reasons, Redis 2.8.13 introduced a new feature called Latency Monitoring, that helps the user to check and troubleshoot possible latency ...
Keywords
Microsoft specialist, Microsoft guru, Microsoft professional, Microsoft consultant, Microsoft authority
