Quick Comparison of Ranges in Excel - Ultimate Guide
Unleash your Microsoft skills with expert Excel comparison methods by Access Analytic. Master Conditional Formatting and more!
Wyn Hopkins [MVP] shares a valuable technique on comparing data ranges using Excel's features. The focus is on helping users of Excel identify discrepancies between two datasets conveniently. While based in Australia, his expertise in Power BI and Excel help clients worldwide better understand and manipulate their data.

Quick comparison of data ranges can be achieved through Conditional Formatting, using formulas to highlight differences. Formulas such as =NOT(B3=F3) compare data in corresponding cells, while =COUNTIF(F3:H14,B3)=0 checks for unique occurrences in columns. A User Defined Function (UDF) can compare entire rows within a dataset for more comprehensive analysis.
To enhance formula clarity, assign named ranges to the data segments being compared, for instance "Table1" and "Table2". It's critical to remember when comparing that numbers formatted as text are deemed greater than their numeric equivalents, which can affect the outcome of comparisons.
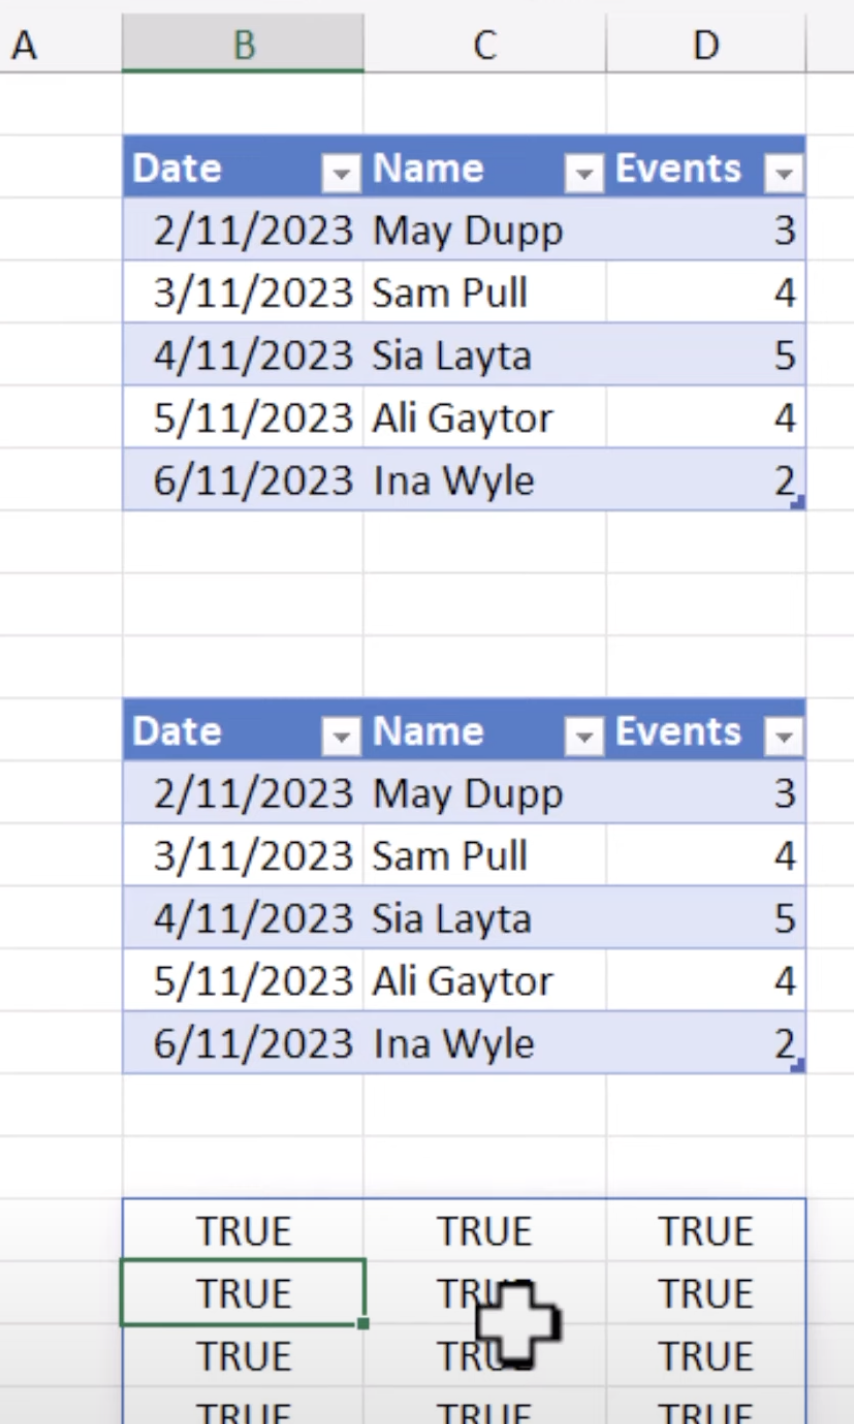
Using Conditional Formatting, Excel can compare every cell across two tables. By applying the formula "=NOT(B3=F3)" in the Conditional Formatting dialog, differences are highlighted with selected formatting styles, such as a red background for easy identification.
Sum totals of differing cells are calculated using an Array Formula, which requires the specific entry method of Ctrl + Shift + Enter. This functionality aids in quantifying the differences between data ranges quickly and effectively.
When comparing data occurrences with Conditional Formatting and the COUNTIF function, cells with matching data remain unshaded. For instance, the number 78 in cell "D5" won't have formatting applied if there's a matching 78 in cell "H10", signifying an occurrence in both data ranges.
Ensure the cell reference within the COUNTIF function corresponds to the upper left cell of the selection. This anchors the comparison correctly to avoid any errors in data analysis.
Additionally, the use of a UDF and Conditional Formatting can compare rows to see if they appear within a table. A specifically formulated UDF will highlight the presence or absence of entire rows, helping users understand the composition of their data at a granular level.
Wyn Hopkins provides a Public Function, MatchingRow, which can be implemented in Excel to assist users in row-level data comparison. The function checks for a row's presence within a table and returns the row number if found, or zero otherwise. ColumnsMatching, another function, determines if all cells in a row match.
- Excel provides powerful tools for comparing data ranges.
- Conditional Formatting and various formulas like NOT, COUNTIF, and UDFs simplify finding discrepancies.
- Understanding data formatting and the usage of named ranges enhances data comparison accuracy.
- Calculating differences effectively employs special commands like Array Formulas.
- Custom functions can offer tailored solutions for row comparisons within Excel sheets.
These capabilities solidify why Excel remains a leading tool for data analysis and management. Tailoring functions and utilizing built-in features cater to precise data assessment needs, empowering users to make informed decisions based on their datasets.
Further Insights on Data Comparison in Spreadsheet Software
Comparing data effectively is a fundamental feature in spreadsheet software, allowing users to identify inconsistencies, errors, or changes. This is essential for financial analysis, inventory tracking, or any situation where data integrity is critical. Advanced features like Conditional Formatting and special formulas enable a high level of detail in the comparison process, making it an invaluable skill for anyone working extensively with Data Analytics.

Learn about Excel Quick Compare Ranges
The tutorial video found on YouTube helps the user on using Microsoft Excel, providing practical information for comparing different data ranges. It provides different methods to match or differentiate data ranges including cell by cell approach, column versus column, or comparing entire rows of data.
To clarify, the tutorial concentrates on three main methods of data comparison. Firstly, it takes an in-depth look at comparing every individual cell in the data set relative to its position in a table. Here, the tutorial sees the use of Conditional Formatting alongside the formula "=NOT(B3=F3)" as equals to content comparison.
This video also explains how you can examine the occurrences of data in each column. It employs the =COUNTIF formula to determine non-occurring items. The example in the video shows that no cells in the middle column are shaded as all the items occur in both tables. Conversely, numerical values present in both tables are not shaded, indicating their presence in both data ranges.
Lastly, the video delves into the process of comparing rows. Here, it introduces a user-defined function to identify and highlight rows that either appear or do not appear in the tables.
- A user-defined function called MatchingRow allows you to pass a single row of cells and a table of cells.
- Other function, ColumnsMatching, determines the number of matching columns within a given row.
The tutorial wraps up by illustrating the significance of user-defined functions in data comparison procedures. It emphasizes how they can be customized to facilitate easier comparison of rows as well as cells.
Understanding Data Comparison in Excel
Data comparison in Excel is a useful tool for data analysis activities. By employing various functionalities and formulas, users can easily and effectively compare data ranges based on different needs. Knowing what you're comparing and the result you're after will define the how to use these comparison tools.
Keywords
Excel Quick Compare Ranges, Compare Excel Ranges Quickly, Excel Range Comparison, Excel Comparison Tools, Quick Excel Comparison, Compare Excel Data Range, Excel Range Matching, Excel Compare Two Ranges, Excel Quick Analysis, Excel Quick Match Ranges
